Comparing Random Walk Stationary Distributions
Introduction
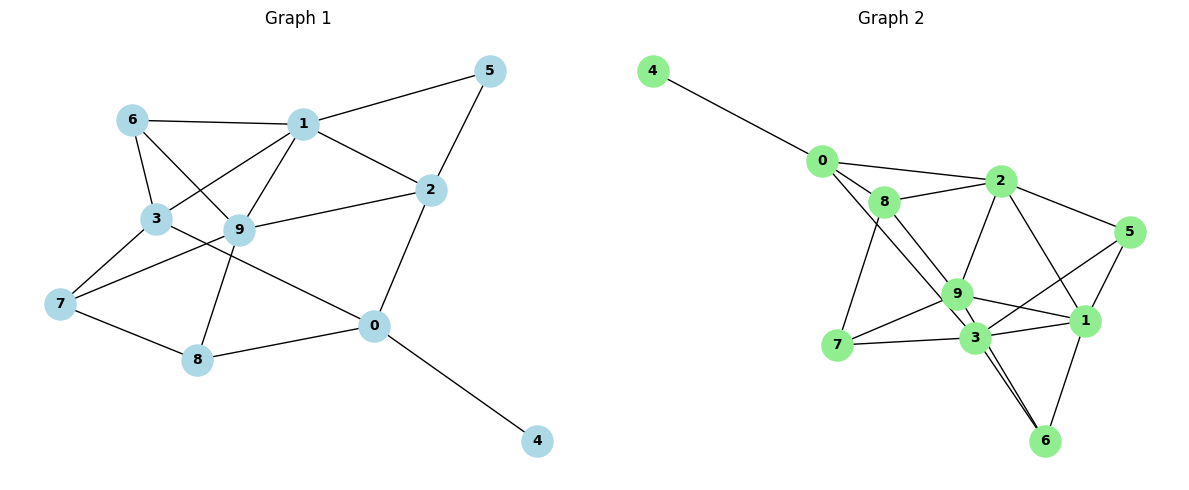
The ComparingRandomWalkStationaryDistributions class is a Python implementation for comparing the stationary distributions of random walks on graphs. This class provides methods to compute and compare stationary distributions, perform random walks, and analyze the characteristics of these walks on different graph structures.
Understanding Graph Distances
In the context of graph theory and network analysis, the concept of “distance” between graphs is crucial for understanding structural similarities and differences. The Distance class focuses on one particular aspect: the behavior of random walks on these graphs.
A random walk on a graph is a stochastic process where a walker moves from node to node along the edges of the graph, choosing the next node randomly from the set of neighbors of the current node. The stationary distribution of a random walk represents the long-term probability of finding the walker at each node, assuming the walk continues indefinitely.
Formal Definition of Distance Metrics
The Comparing Random Walk Stationary Distributions class implements three distance metrics for comparing stationary distributions:
L1 Distance (Manhattan Distance):
\[d_{L1}(P, Q) = \sum_{i} |P_i - Q_i|\]L2 Distance (Euclidean Distance):
\[d_{L2}(P, Q) = \sqrt{\sum_{i} (P_i - Q_i)^2}\]Kullback-Leibler (KL) Divergence:
\[D_{KL}(P || Q) = \sum_{i} P_i \log(\frac{P_i}{Q_i})\]
Where \(P\) and \(Q\) are the stationary distributions of the two graphs being compared.
Key Features
Computation of stationary distributions
Comparison of stationary distributions using multiple distance metrics
Simulation of random walks on graphs
Analysis of random walk characteristics (average length, node visit frequencies)
Usage Example
Here’s a basic example of how to use the Distance class:
from distancia import ComparingRandomWalkStationaryDistributions

# Création de deux graphes d'exemple
graph1 = Graph(directed=False, weighted=True)
graph1.add_edge("A", "B", 1.0)
graph1.add_edge("B", "C", 2.0)
graph1.add_edge("C", "A", 1.5)

graph2 = Graph(directed=False, weighted=True)
graph2.add_edge("A", "B", 2.0)
graph2.add_edge("B", "C", 1.0)
graph2.add_edge("C", "D", 1.0)
graph2.add_edge("D", "E", 1.0)

distance, dist1, dist2 = ComparingRandomWalkStationaryDistributions().compute(graph1, graph2)
print(f"Distance L1: {distance}")
print(f"Distribution stationnaire graphe 1: {dist1}")
print(f"Distribution stationnaire graphe 2: {dist2}")
Output
Distance L1: 0.7999999999999999
Distribution stationnaire graphe 1: {'B': 0.3333333333333333, 'C': 0.3333333333333333, 'A': 0.3333333333333333, 'E': 0.0, 'D': 0.0}
Distribution stationnaire graphe 2: {'E': 0.2, 'D': 0.2, 'B': 0.2, 'C': 0.2, 'A': 0.2}
Academic References
Conclusion
The Distance class provides a powerful tool for comparing graphs based on the behavior of random walks. By analyzing the stationary distributions and characteristics of random walks, researchers and data scientists can gain insights into the structural similarities and differences between graphs. This approach has applications in various fields, including network analysis, community detection, and machine learning on graph-structured data.
Future work could involve extending the class to handle directed and weighted graphs, implementing more sophisticated distance metrics, or integrating this functionality into larger graph analysis frameworks.